When it comes to analyzing the potential of an income producing property, most people focus on Cash on Cash return as the only measure of their real estate return on investment. However, to get a complete picture of the return of your real estate investments, there is an array of metrics that you should include as part of your rental property analysis.
While initially overwhelming, in this post I’ll break down each metric, provide the formula to calculate it, and show you examples, using a real-life advertised deal. In addition, I’ll also go into how these figures and ratios relate to each other.
The total picture you get from preparing an analysis with all of these metrics will show you not only how well a potential property is being run and managed, it will help you compare that property to other similar properties for sale, allow you to determine cash flow, evaluate the true price for a property, and much more.
Applicability
You can apply the information in this guide to the following types of investments:
- A single family, duplex, triplex, or quad rental
- A multi-family property with 5 or more units
- Any property to apply the BRRRR (Buy, Rehab, Rent, Refinance, Repeat) method
Organization
This post is divided into the following major areas to analyze, broken down into 18 metrics:
- Scheduled Gross Rents
- Scheduled Other Income
- Total Scheduled Gross Income
- Vacancy Loss
- Effective Gross Income
Net Operating Income and Expense Metrics
- Cash Flow
- Property Value
- Capitalization Rate
- Gross Rent Multiplier
- Operating Expense Ratio
- Outstanding Loans
- Equity
- Profit From Sale
Internal Rate of Return: The Most Important Metric
The Example Duplex
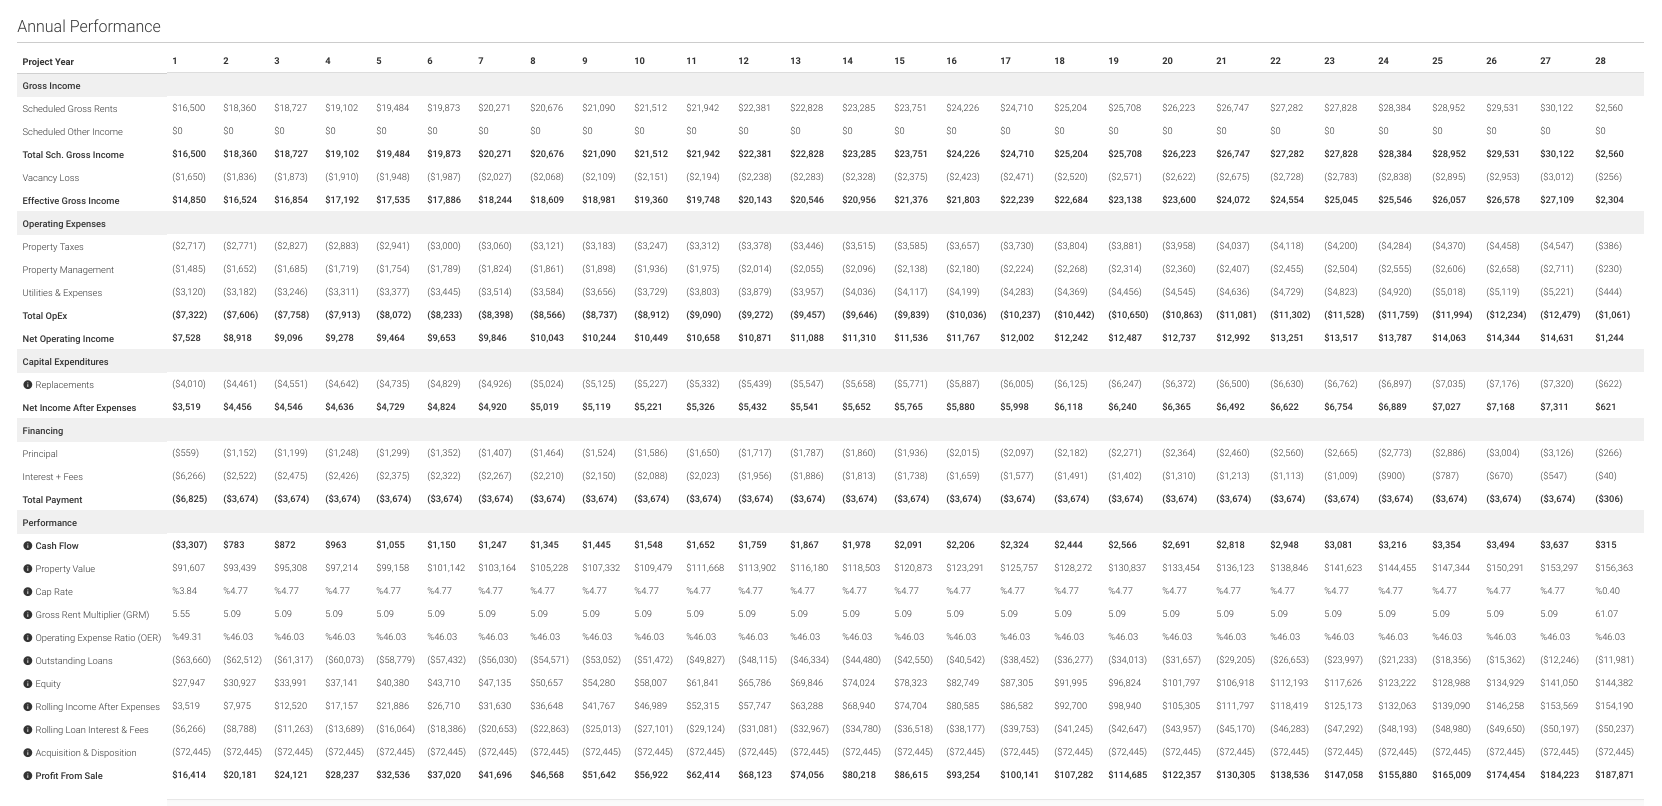
For the examples throughout the post, I’ll be analyzing a duplex property with the following assumptions:
Purchase Price: $64,900
ARV: $91,607
Unit 1 Rents: $750
Unit 2 Rents: $750
Rent growth rate: 2%
Vacancy rate: 10%
Holding Period: 27 years
Rehab cost: $32,000
Property will be vacant during the rehab period of 1 month.
Property Taxes: $2717/year
Property Management: $135/mo at 10%
Utilities and Expenses: $260/mo
Expense growth rate: 2%
Note: All calculations are rounded to the nearest dollar, and use a 360 day year
Now that we know what we’re working with, let’s dive into the 18 due diligence formulas you need to gauge which of your potential properties will result in the highest return on investment.
Gross Income Metrics
This section outlines the pre-tax, and pre-expense income that you should expect from the property.
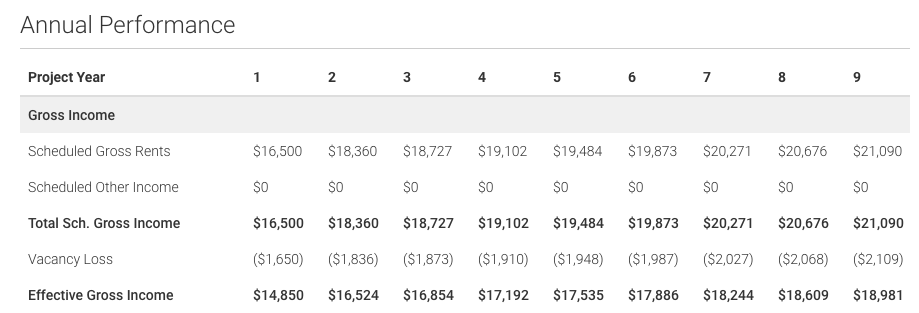
Scheduled Gross Rents
What is it?
Scheduled Gross Rents shows you the potential of an income-producing property. This figure represents the maximum possible annual income for the property from rents, and does not take into account vacancy or any other losses. It is the amount you would get if all units were rented at fair market value and all payments were collected, in its current condition.
Also referred to as: gross scheduled income, scheduled gross income, potential gross income
How is it calculated?
![]()
Example:
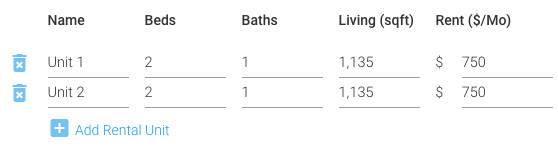
If our property were ready to rent when we bought it, $18,000 would be our initial annual income.
$750 per Unit * 2 = $1,500 Monthly Income
$1,500 * 12 = $18,000 per year in Scheduled Gross Rents
As is often the case, after a property is purchased there may be repairs or upgrades required before it can be put into service. Until such time, it cannot collect rents and therefore cannot schedule any income.
Our example duplex’s Scheduled Gross Rents example does take into account that there is a rehab period of 1 month during the first year; the rehab period rental amount will be subtracted from the first year annualized scheduled gross rents:
$18,000 – $1,500 for 1 month rehab vacancy = $16,500 first year Scheduled Gross Rents
Scheduled Other Income
What is it?
This refers to any income that can be generated by the property outside of the scheduled gross rents. Some examples include coin laundry on site, vending machines, additional parking, pet/late fees, or storage.
Scheduled Other Income is based on maximum utilization of the amenities.
How is it calculated?
![]()
Example:
Our duplex example does not have any additional income generated outside of rents, but if it did, the numbers could be:
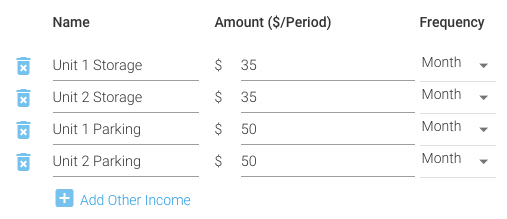
Storage: $35.00 per unit * 2 = $70 per month
Off-street Parking: $50.00 per unit *2 = $100 per month
$70 + $100 = $170
$170 * 12 = $2040 per year in Scheduled Other Income
Total Scheduled Gross Income
What is it?
Total Scheduled Gross Income is the sum total of the annualized Scheduled Gross Rents and Scheduled Other Income, which represents the true maximum potential income of the property.
How is it calculated?
![]()
Example:
$16,500 + 0 = $16,500 in Total Scheduled Gross Income
Annual Rent Growth Rate
Rents rarely stay flat, and hopefully you are buying in a market where rents are growing at a rate that is at least commensurate with the rate of inflation. You should account for this growth in your annual performance analysis, and can do so in the REIkit.com rental analysis software.
Vacancy Loss
What is it?
Vacancy loss is the dollar amount per year, usually entered as a vacancy rate for the year that you can attribute to unoccupied rental units. It also includes non-payment of rents or defaults on lease, known as collection loss.
Also referred to as: Vacancy Factor, Collection Loss Factor, Non-payment Risk
Where can you get the Vacancy Rate?
There are three ways you can find the Vacancy Rate for an area:
Stated Vacancy
As a starting point you can use the pro-forma or rent rolls provided to you and divide the total number of vacant units by the total number of units available.
![]()
Local Realtor
Preferably, you’d ask a local realtor for the Vacancy Rate in the area that the property is located in.
Census Data
In a pinch, you can use the 75 metropolitan areas or state vacancy rates from the 2020 Housing Vacancies and Homeownership by the United States Census Bureau:
https://www.census.gov/housing/hvs/data/ann20ind.html
Why is knowledge of the area Vacancy Loss Rate important?
Knowing the average vacancy rate for an area will help you determine if a property’s vacancy is high or low for an area, and therefore whether the property is over or under utilized when compared to other similar properties in the area.
The rule of thumb is that 5%-8% is considered standard, but it really depends on the property and its location.
Generally speaking, the lower the percentage, the better, for a number of reasons:
Tenants are staying and paying, indicating satisfaction
It may point to an area being a landlord’s market, rather than a renter’s market
There may be room to increase rents
If the percentage is high for the area, the opposite may be true. The property may lose tenants due to deferred maintenance, unresponsive property management, bothersome tenants, or the physical location of the property may be less than ideal.
How is it calculated?
![]()
Example:
In our duplex scenario, the overall vacancy rate is 10%, so our formula would be:
$16,500 * .10 = $1,650 in Vacancy Loss
Effective Gross Income
What is it?
The Effective Gross Income is the income you should expect to receive from the property when accounting for vacancy losses.
How is it calculated?
![]()
Example:
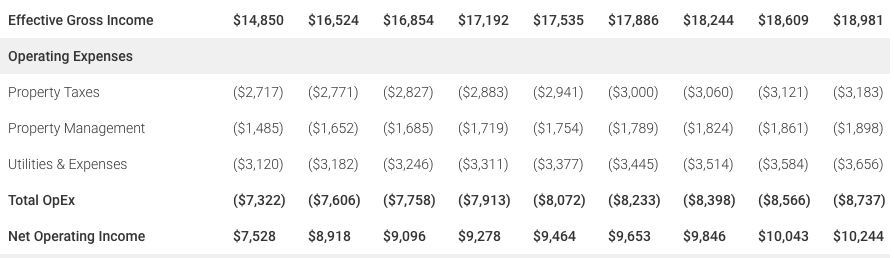
$16,500 – $1,650 = $14,850 in Effective Gross Income
Net Operating Income and Expense Metrics
Operating Expenses (OpEx)
Operating Expenses are costs for ongoing upkeep and running of a property. Operating expenses include property taxes, property management, mowing, trash pickup, office supplies, insurance, or accounting fees, among many others.
Property Taxes
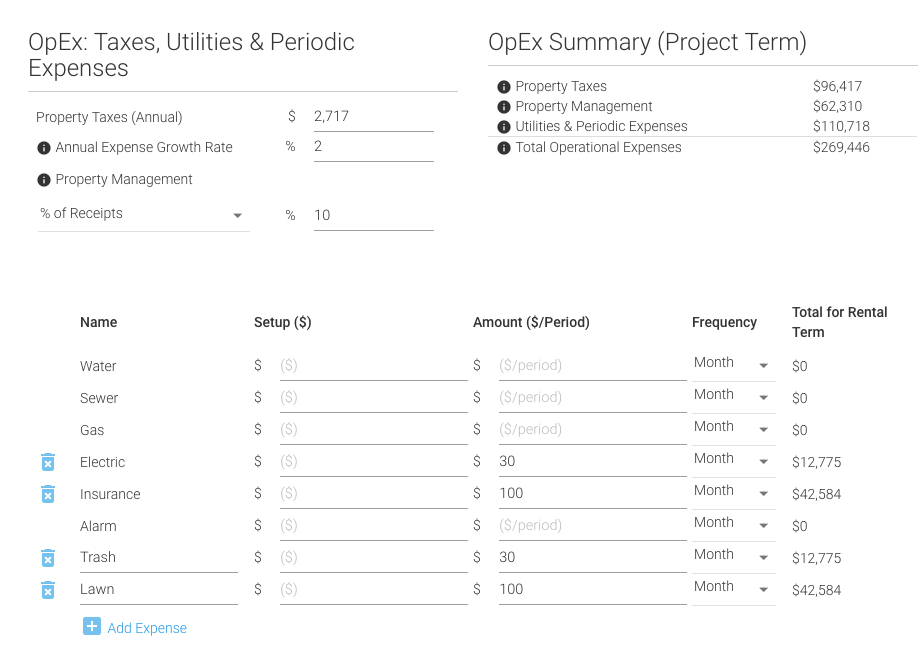
When you calculate property taxes, make sure that you enter the expected property taxes that will be assessed when you purchase the property. Beware of using current taxes assessed on the property based on a much lower purchase price.
Property Management
Property management can be captured either as a monthly fee, or as a percentage of receipts in the range of 5-10% of the gross income of the property.
Utilities
Although tenants pay most of the utilities, there are still some common utilities that are billed to the property owner. This might include electric for the common areas, insurance, and any yard maintenance services.
How are operating expenses calculated?
![]()
Example:
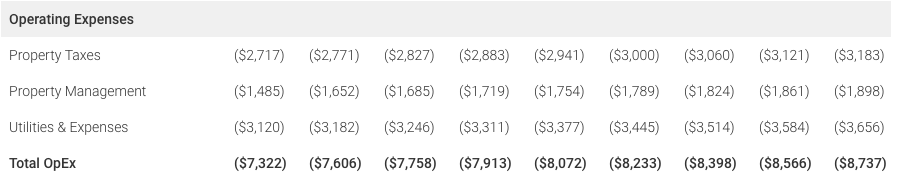
Property taxes: $2,717/year
Property Management: $135/mo * 11 = $1,485
Utilities and Expenses: $260/mo *12 = $3,120
$2717 + $1,485 + $3,120 = $7,322 in OpEx for the year
Annual Expense Growth Rate
Something that is frequently forgotten is that operating expense costs grow over time, often at or above the rate of inflation. This can be accounted for by adding an annual expense growth rate to the annual performance analysis within the REIkit.com software.
Net Operating Income (NOI)
What is it?
If you recall, Effective Gross Income is the pre-tax, pre-expense, income that the property generates from gross rents, laundry facilities, vending machines, and the like.
Net Operating Income (NOI) is the Effective Gross Income minus total Operating Expenses. NOI does not take into account your financing costs or CapEx.
How is it calculated?
![]()
Example:
$14,850 – $7,322 = $7,528 in Net Operating Income
Capital Expenditures (CapEx) / Replacements
What is it?
The Replacements calculation is the sum of all one-time replacement costs for an asset. These major costs could be, for example, a new roof, new A/C units, or replacing the flooring in all units.
Replacements are not to be confused with reoccurring costs such as painting on move-out or cleaning carpets. One way to determine if an item is considered a major cost, or a reoccurring cost, is to ask yourself: what is the intention behind the purchase or action? If the intention is to improve or upgrade the property to a better or like new condition, that would be a Replacement, whereas if the intention is to simply repair or maintain in its current condition what already exists, that is likely a reoccurring cost.
This distinction is important because reoccurring costs are taken out of an operating budget as an immediate expense taken out of the OpEx fund. If intended to improve the property or upgrade it to like new condition, however, it would come out of the CapEx fund and be depreciated over time.
Also referred to as: Capital Improvements
How is it calculated?
There are two ways to plan for Replacement costs.
Holdback Based On a Percentage of Receipts
You can use a percentage of your Gross Scheduled Income for a holdback amount, so that you have a consistent expense amount that you can plan for in your analysis. This presumes you know how much you should hold back to meet your future CapEx obligations. A lot of people start off with a 5-10% holdback amount.
Holdback Based On Expected System Lifetime
The most thorough way to determine Replacement cost is by using the life cycle of individual systems and mapping out repairs that span the entire duration of property ownership. This method utilizes well-known replacement timelines for each expense.
For example, 20 years is a typical lifetime for a roof; ergo, if the roof of a property you are analyzing is estimated to be 10 years old, then you can reasonably assume that sometime in the 10th year of your property ownership, you will need $10,000 in reserves to pay for the roof replacement.
Will you have held back enough in your reserves for such a large repair? When you consider the many parts of a building that can wear out, the effort you expend researching and preparing a life cycle calculation will result in an exceptional understanding of expenses.
The Best Way: A Combined Approach
The best method is a combination of the two, where you use the lifecycle method to calculate the expected expenses over your holding period, then translate that into a percentage of gross income over the holding period so that you can have a predictable holdback amount each month.
Whatever method you use it is recommended to also add in the Annual Expense Growth Rate to each year of ownership. A minimum expense growth rate that you should expect would be around 2%, or whatever is the prevailing inflation rate.
Example:
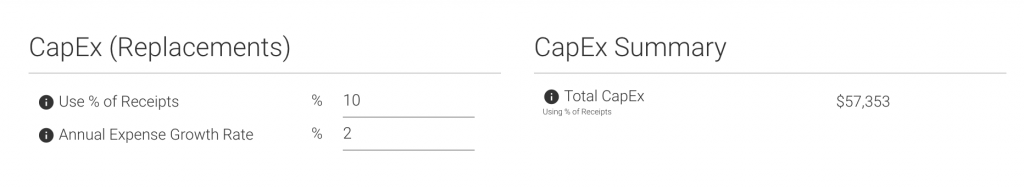
In the duplex example, I started off with the commonly used 10% holdback percentage, based on the holding period Effective Gross Rent ($573,532) that totaled $57,353 over the holding period of the property.
To double-check if that amount would be adequate, I also prepared a life cycle plan:
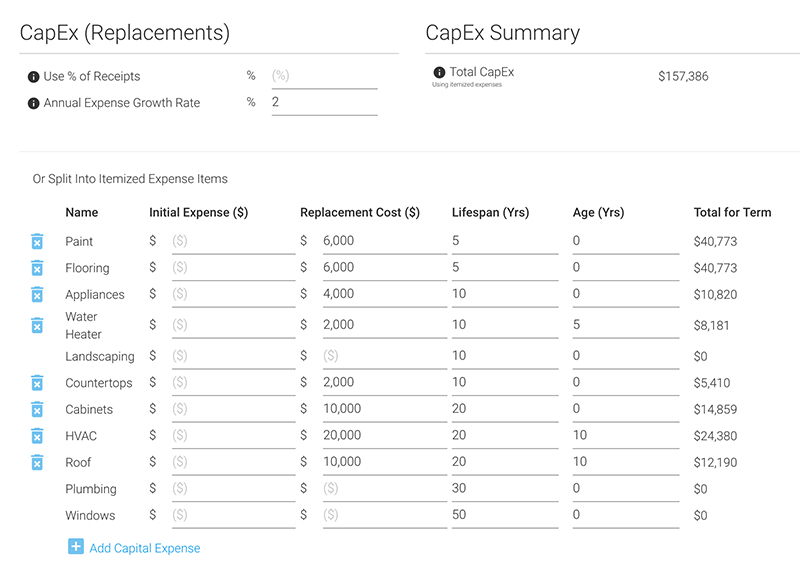
Using the life cycle plan resulted in calculations of a minimum of $157,386 in Replacements over the ownership period, much more than originally estimated.
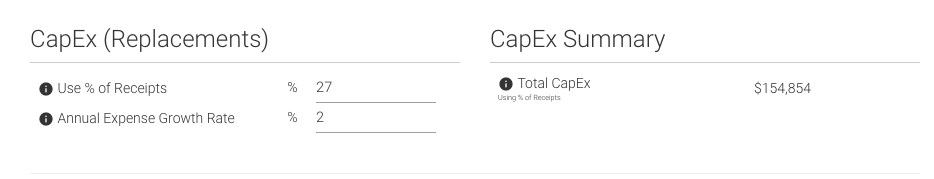
To reach that amount of replacements, one would need to hold back closer to 27% of receipts, planning for an annual Replacement cost starting at $4,010 in the first year.

Net Income After Expenses
What is it?
This is the Net Operating Income minus Replacements.
Also known as: Cash Flow From Operations (CFO), Unlevered Cash Flow
How is it calculated?
![]()
Example
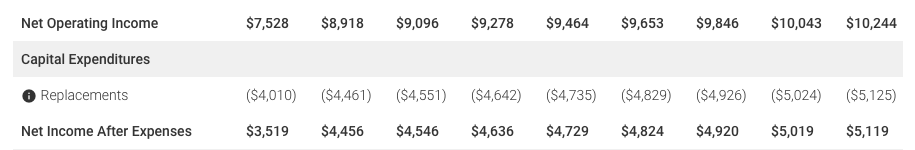
$7,528 – $4,010 = $3,519 in Net Income After Expenses
Performance Metrics
Cash Flow
What is it?
The Cash flow of a property is one of the first performance metrics that most real estate investors think of when they question whether a property will be profitable. Although a negative cash flow doesn’t necessarily mean that the deal is a bust, that is if appreciation is adequate, a high positive cash flow is the fundamental goal of real-estate investment.
Cash flow is the amount resulting after your Debt Service (your principal and interest payments) is subtracted from your Net Income After Expenses.
One rule of thumb for estimating if positive cash flow results in profitability is that the resulting number represents 6-8% of profit over the monthly rent amount.
Also referred to as: Cash Flow After Financing, Net Cash Flow, Levered Cash Flow
How is it calculated?
There are two types of cash flow: before tax cash flow and after tax cash flow. Before tax cash flow is what I’m covering in this Cash Flow section, as the tax rate may be different for each situation and difficult to model. Before tax cash flow is computed like this:
![]()
Example:
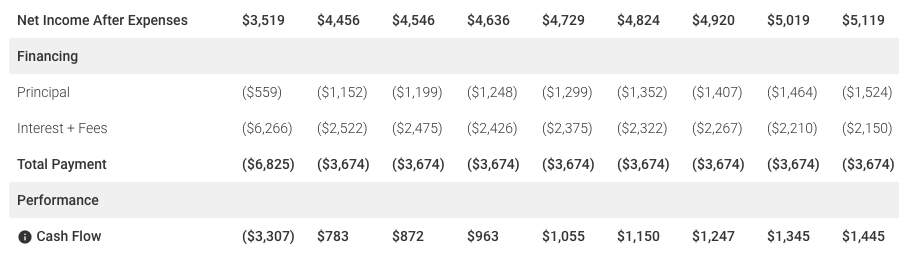
$3,519 – $6,825 = -$3,307 in Before Tax Cash Flow
In the first year, we experience negative cash flow due to much higher debt service fees due to higher priced hard money used for the rehab portion.
Property Value
What is it?
The initial property value/purchase price is the starting point so that you can track the property’s appreciation, and determine what you expect the property to sell for at the end of your holding period.
How is it calculated?
One to four units
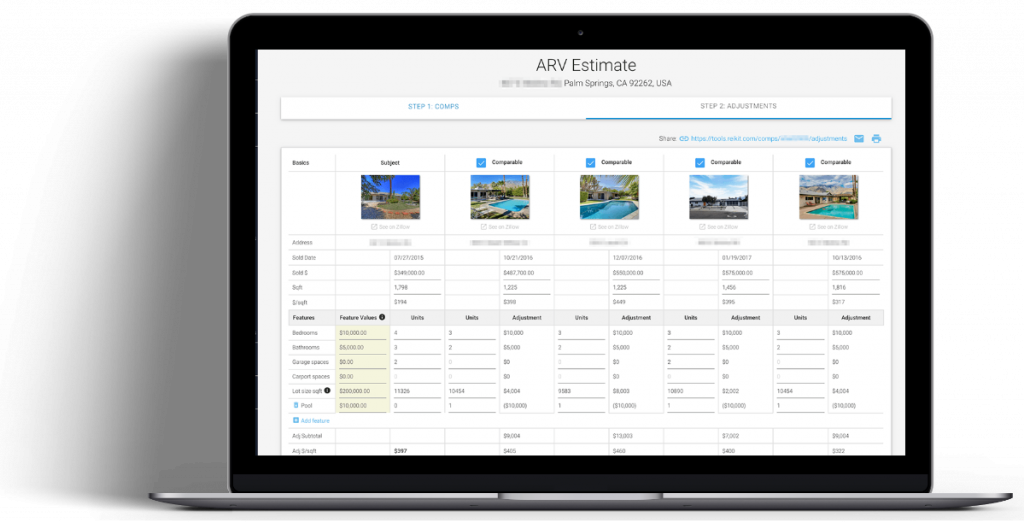
For 1-4 unit properties, value is determined by finding the After Repair Value (ARV) through running a sales comparison analysis of comparable properties, and adjusting them for features and amenities.
This article will give you an overview as to how to find comps for your subject property, adjust them, and calculate the ARV of the property:
Five plus units
For commercial multi-family properties with 5 plus units, this value should be determined by the income approach, where:
![]()
You can get the Cap Rate from your local realtor, and use the NOI from your earlier calculations to help you come up with the value of the property.
Example:
Let’s say that this duplex was actually a 6 unit multi-family building, with a cap rate of 7%. Given that our Net Operating Income (NOI) for this property was $7,528, then according to the income approach, the value of the property would be:
$7,528 / 7% = $107,542 Property Value
Capitalization Rate (Cap Rate)
What is it?
Cap Rate gives you a benchmark by which to compare the various properties that you analyze. It is particularly useful when it is difficult to find comparable sold properties, as is often the case with apartment buildings of differing sizes and bed/bath ratios. However, for the best use of the cap rate, the properties should at a minimum be the same type, in similar locations, and have sold prices relatively within the same time period.
Ask a real estate agent, lender, or appraiser for the area Cap Rate where the property is located.
By finding out the standard cap rate for an area, and using the calculation below on each potential property, you will be able to determine if a property is performing well in an specific area, and how the properties compare to each other. The higher the cap rate, the more likely the property carries higher risk.
How is it calculated?
![]()
Example:
Net Income After Expenses: $3,519. Property Value: $91,607.
$3,519 / $91,607 = 3.84% Cap Rate
Gross Rent Multiplier (GRM)
What is it?
The Gross Rent Multiplier is used as a quick and dirty way to determine if the asking price of a potential property is overvalued or undervalued.
The multiplier is a ratio between the property value and the total rents and so it is an indicator of how many years it will take for a property to pay itself off. Therefore a lower GRM is what you’re looking for, preferably below 8 years.
Gross Rent Multiplier does not take Vacancy or OpEx into consideration, so keep that in mind as a limitation. Since Cap Rate is based off of the Net Operating Income it is a superior to GRM in terms of accuracy, however GRM can still be used effectively for quick price comparisons between two like properties.
Also known as: Gross Rate Multiplier, Gross Income Multiplier (GIM)
How is it calculated?
![]()
Example:
Property Value: $91,607. Annual Scheduled Income: $16,500.
91,607 / 16,500 = 5.55 years to pay off the property using gross income
Operating Expense Ratio (OER)
What is it?
The Operating Expense Ratio is another indicator of whether a property is being managed well. It can be used to compare the operating costs of like properties. You take the total operating expenses (OpEx) for the property and divide it by the effective gross income (EGI).
A lower ratio indicates that a property is being run efficiently, as less of the income is being used to operate the property. As with most of these calculations, you are able to compare the expenses of the subject property with comparables to gauge how efficiently the property is being run.
How is it calculated?
![]()
Example:
-7,322 / 14,850 = 49.31% Operating Expense Ratio
Outstanding Loans & Leverage
Leverage is your ability to borrow other people’s money with the expectation that the cash flow and appreciation will exceed the cost to borrow and will therefore expand your opportunities to profit.
How much should you leverage?
Investors’ relationship with leverage is complicated to say the least.
On the one hand you have the mindset of those who want to pay off all debts of a property as fast as possible, sacrificing initial cash flow for quicker out-right ownership, lower total interest cost, and eventual maximum cash flow, at the cost of scale. Nothing makes this group of investors happier than having the outstanding debt go to zero within the first 10-15 years of ownership.
On the other hand with historically low interest rates, the cost of leverage is low enough that by leveraging as much as possible for as long as possible, you can far more effectively deploy your cash in as many deals as possible and make the money you have work for you much more efficiently. It will take you far longer to start seeing any significant cash flow out of nearly completely leveraged properties, but if you can last that long, you will have amassed a far larger portfolio of properties.
So the trick is to last long enough to be able to do that. In order to last in this business involves making all of the right tradeoffs with a balance of equity, debt, reserves, and liquidity that allows you to use your cash as efficiently as possible, and still be able to respond to unexpected problems (which you should expect), and not need to liquidate properties to be able to address those problems.
How is it calculated?
This is the principal remaining of all of your loans at the end of the year.
Equity
What is it?
Equity is the flip side of the Outstanding Loans. Equity is the value of the property minus any outstanding debt.
Your equity should grow over time as long as your property is in an appreciating market, or neighborhood, and you should make sure that your calculations take an annual appreciation rate into account when assessing property value.
The other side that grows equity is the paying off of any outstanding debt.
Both of those work separately and together to increase or decrease your equity in the property.
How is it calculated?
![]()
Example:
$91,607 – $63,660 = $27,947
Profit From Sale
Eventually after your depreciation period, you might want to sell the property in exchange for a new asset so as to restart the depreciation clock once again.
Your profit from the sale of the property is another important consideration of the performance of your investment.
How is it calculated?
The annual profit from the sale of the property is a measure of the appreciated value of the property, plus the sum of all of the cash flows, minus any outstanding debt, and purchase and sale costs.
Internal Rate of Return
This is perhaps one of the most important metrics that you can use to determine the performance and desirability of your investment property, especially in comparison to other investments. These investments do not have to be similar to each other.
IRR is a discounted cash flow metric that is the rate at which the Net Present Value of your cash flows is zero.
How is it calculated?
Internal Rate of Return cannot be calculated analytically, and requires special trial-and-error algorithms to find the best value. This is standard in REIkit.com rental analysis software.
Summary
In this post I went over many metrics required to give you a complete picture of the rental property analysis puzzle. The metrics and calculations are crucially important to help you in evaluating a potential rental property. Each of those numbers, ratios, and percentages taken together reveal a far more accurate picture of the financial health of a property than you can achieve from a Cash on Cash Return (CCR) analysis.
I hope this post has been useful for you. If you have additional metrics that you consider important for analysis, or any questions on what you’ve read, let’s hear them in the comments below.
If you’d like to see this example property analysis in action, I created an article and video for you using all of these formulas. Head on over to to watch it: